The Polar Ice Museum is a series of artworks and installations that transform polar data into meaningful public engagement experiences on sea level, climate, and related environmental issues. This project is directed by IRC in collaboration with researchers at ¡HARP, under the leadership of NSF Principal Investigator, Dr. Vandana Janeja,
Significance
 Scientists emphasize that solving climate change requires broad public engagement, yet the abstract nature of climate data often fails to resonate with non-expert audiences. Additionally, the average person perceives what’s going on in the Arctic to be too far away to affect them personally.
Project Description
The Polar Ice Museum is an immersive, data-driven installation that brings the reality of climate change to life through physical and VR/XR experiences. The work surrounds viewers in a living ice cave with shifting forms, driven by HARP and NASA data, within a game-like environment (Unreal Engine). A constellation of monitors arcs in a loose semi-circle, continuously animating glacial movement and climate events, turning the earth’s data into something visceral and immediate.
At the center of the installation is a floating white circular table that features a 3D relief. As dark water fills the relief, it gradually reveals a photographic image of Speed’s Beauty Salon in South Baltimore’s Turners Station neighborhood. This 50-year-old business is part of a community already affected by rising sea levels and is expected to face severe flooding by 2050. By linking polar ice science to a specific local site, The Polar Ice Museum transforms distant climate data into an intimate, place-based experience with urgent consequences.

Only the power of human will and creativity can meet the escalating threat of global warming that is impacting us all.
Collaboration and Methods


Polar researchers at !HARP are part of an international network of scientists dedicated to studying polar ice, including geological constructions, its melting, rising sea levels, and the global impacts that follow. To bridge the gap between complex scientific data and the decision-makers and communities empowered to act, the IRC leverages polar ice research to create data-driven experiences. These experiences illuminate both the dramatic changes occurring in the Arctic and their tangible effects on local landscapes, including Baltimore. Through working with !Harp data, we aim to cultivate meaningful public engagement with the urgent realities of climate instability.
Utilizing ¡Harp’s extensive geological data will describe the phenomenon from regions in Greenland where the geography underneath the snow and ice becomes visible due to a warming climate. Lakes begin to form in the polar region. Therefore, when data from the polar region expresses small amounts of melting, a small amount of colored water will fill the sculpture. When the data shows acceleration, the white sculpture is slowly transformed into a topographical photograph of a lake region. Simultaneously, an underwater audio track of ice in Greenland will be composed, where volume and speed are in sync with the lake spreading.

Early Prototypes
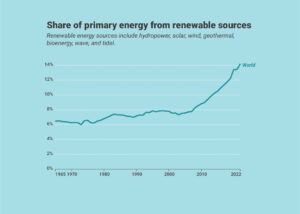
Early prototypes were developed using 3D and virtual reality (VR), designed in Unreal gaming engine software. The graph shown underneath has lead much of our early prototypes, as it provides a very promising statistic that makes change seem possible.


Researchers and Creators
iHARP Principal Investigator: Vandana Janeja, Professor of Information Systems, Associate Dean of the College of Engineering and Information and Technology.
Co-Principal Investigators:
Art Direction: Lisa Moren, Director, Imaging Research Center
User Experience Scientist: Anita Komlodi, Associate Professor of Human-Centered Computing, Information Systems Department
Climate Scientist: Sudip Chakraborty, Research Assistant Professor, ¡HARP project
Policy Advisor: Yusuke Kuwayama, Assistant Professor, Public Policy
Animation and Modeling Lead: Ryan Zuber, Technical Director, IRC Staff
Audio and Music Composition: Evan McRae, Technical Director, IRC C1 Staff
Data Programmer: June Young, Technical Director, IRC C1 Staff
Data Analysis: Iman Asfari, Volunteer Postdoctoral Researcher, Information Systems Department
Students
Research and Production:
Taylor Goad, Graduate Student of Intermedia and Digital Arts, Department of Visual Arts
Lynn Nguyen, Graduate Student of Intermedia and Digital Arts, Department of Visual Arts
Selin Büyükcengiz, Graduate Student of Intermedia and Digital Arts, Department of Visual Arts
Samuel McCarthy, Computer Science BS, Department of Computer Science and Electrical Engineering
Rishitha Achari, Human-Centered Computing student, Information Systems Department
Tobi Williams, Undergraduate Student, Computer Science and Electrical Engineering; Data Science Fellow in the College of Engineering and Information Technology (COEIT)


