A New Way to Understand Our Most Difficult Societal Challenges
Project Description
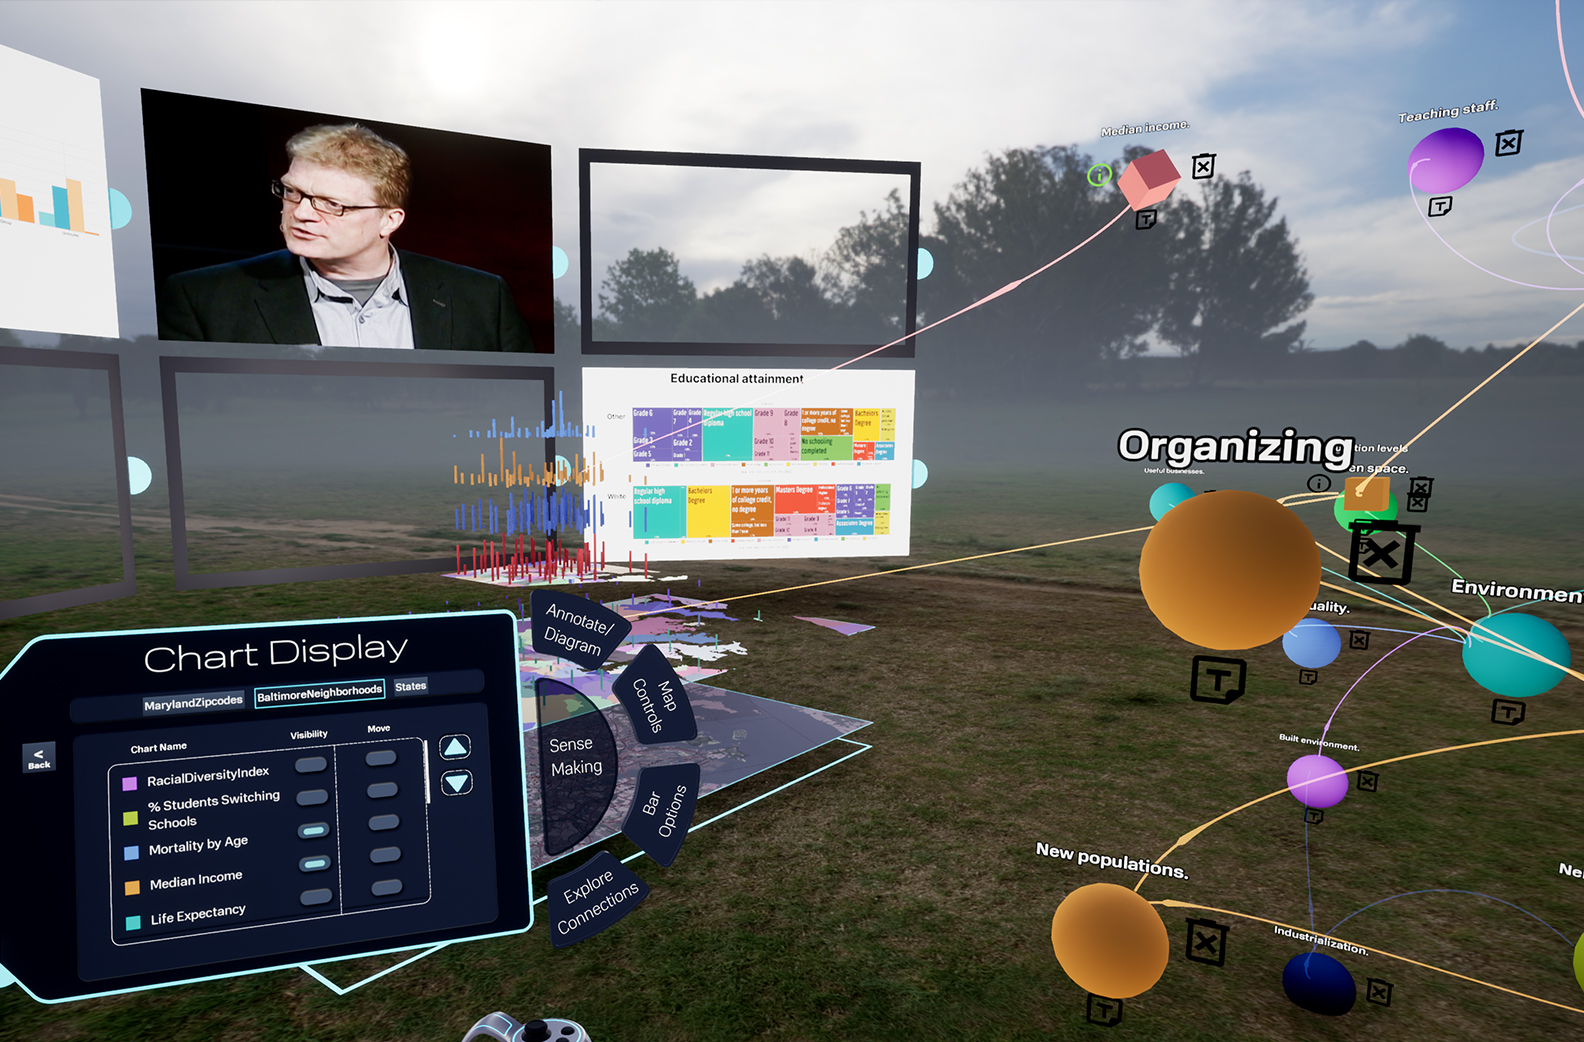
REVLR is an immersive 3D virtual environment designed to help users model and understand complex, adaptive systems. Within this space, users can build visual, conceptual models and explore the data that informs them—all at once, in a unified environment. The platform supports a wide range of information types, from highly quantitative datasets to qualitative insights and even intuitive, early‑stage hypotheses. By placing users inside a spatial, interactive representation of their problem, REVLR makes it possible to see relationships, patterns, and structures that are difficult to grasp through traditional, linear tools.
Significance
Organizations such as government agencies, NGOs, and community‑focused nonprofits increasingly face challenges that are deeply interconnected and multidimensional. Traditional tools—slide decks, spreadsheets, diagramming software, long reports—force these problems into linear formats that cannot capture their true complexity. REVLR addresses this gap by offering a way to visualize entire systems holistically, without overwhelming users.
By enabling people to see the “big picture,” REVLR helps reveal how different factors interact, where new connections or synergies might emerge, and how cultural or qualitative forces—often impossible to measure—shape real‑world outcomes. This capability is especially critical in fields like business intelligence and decision support, where understanding the whole system is essential for anticipating challenges and designing effective interventions.
Methods Used
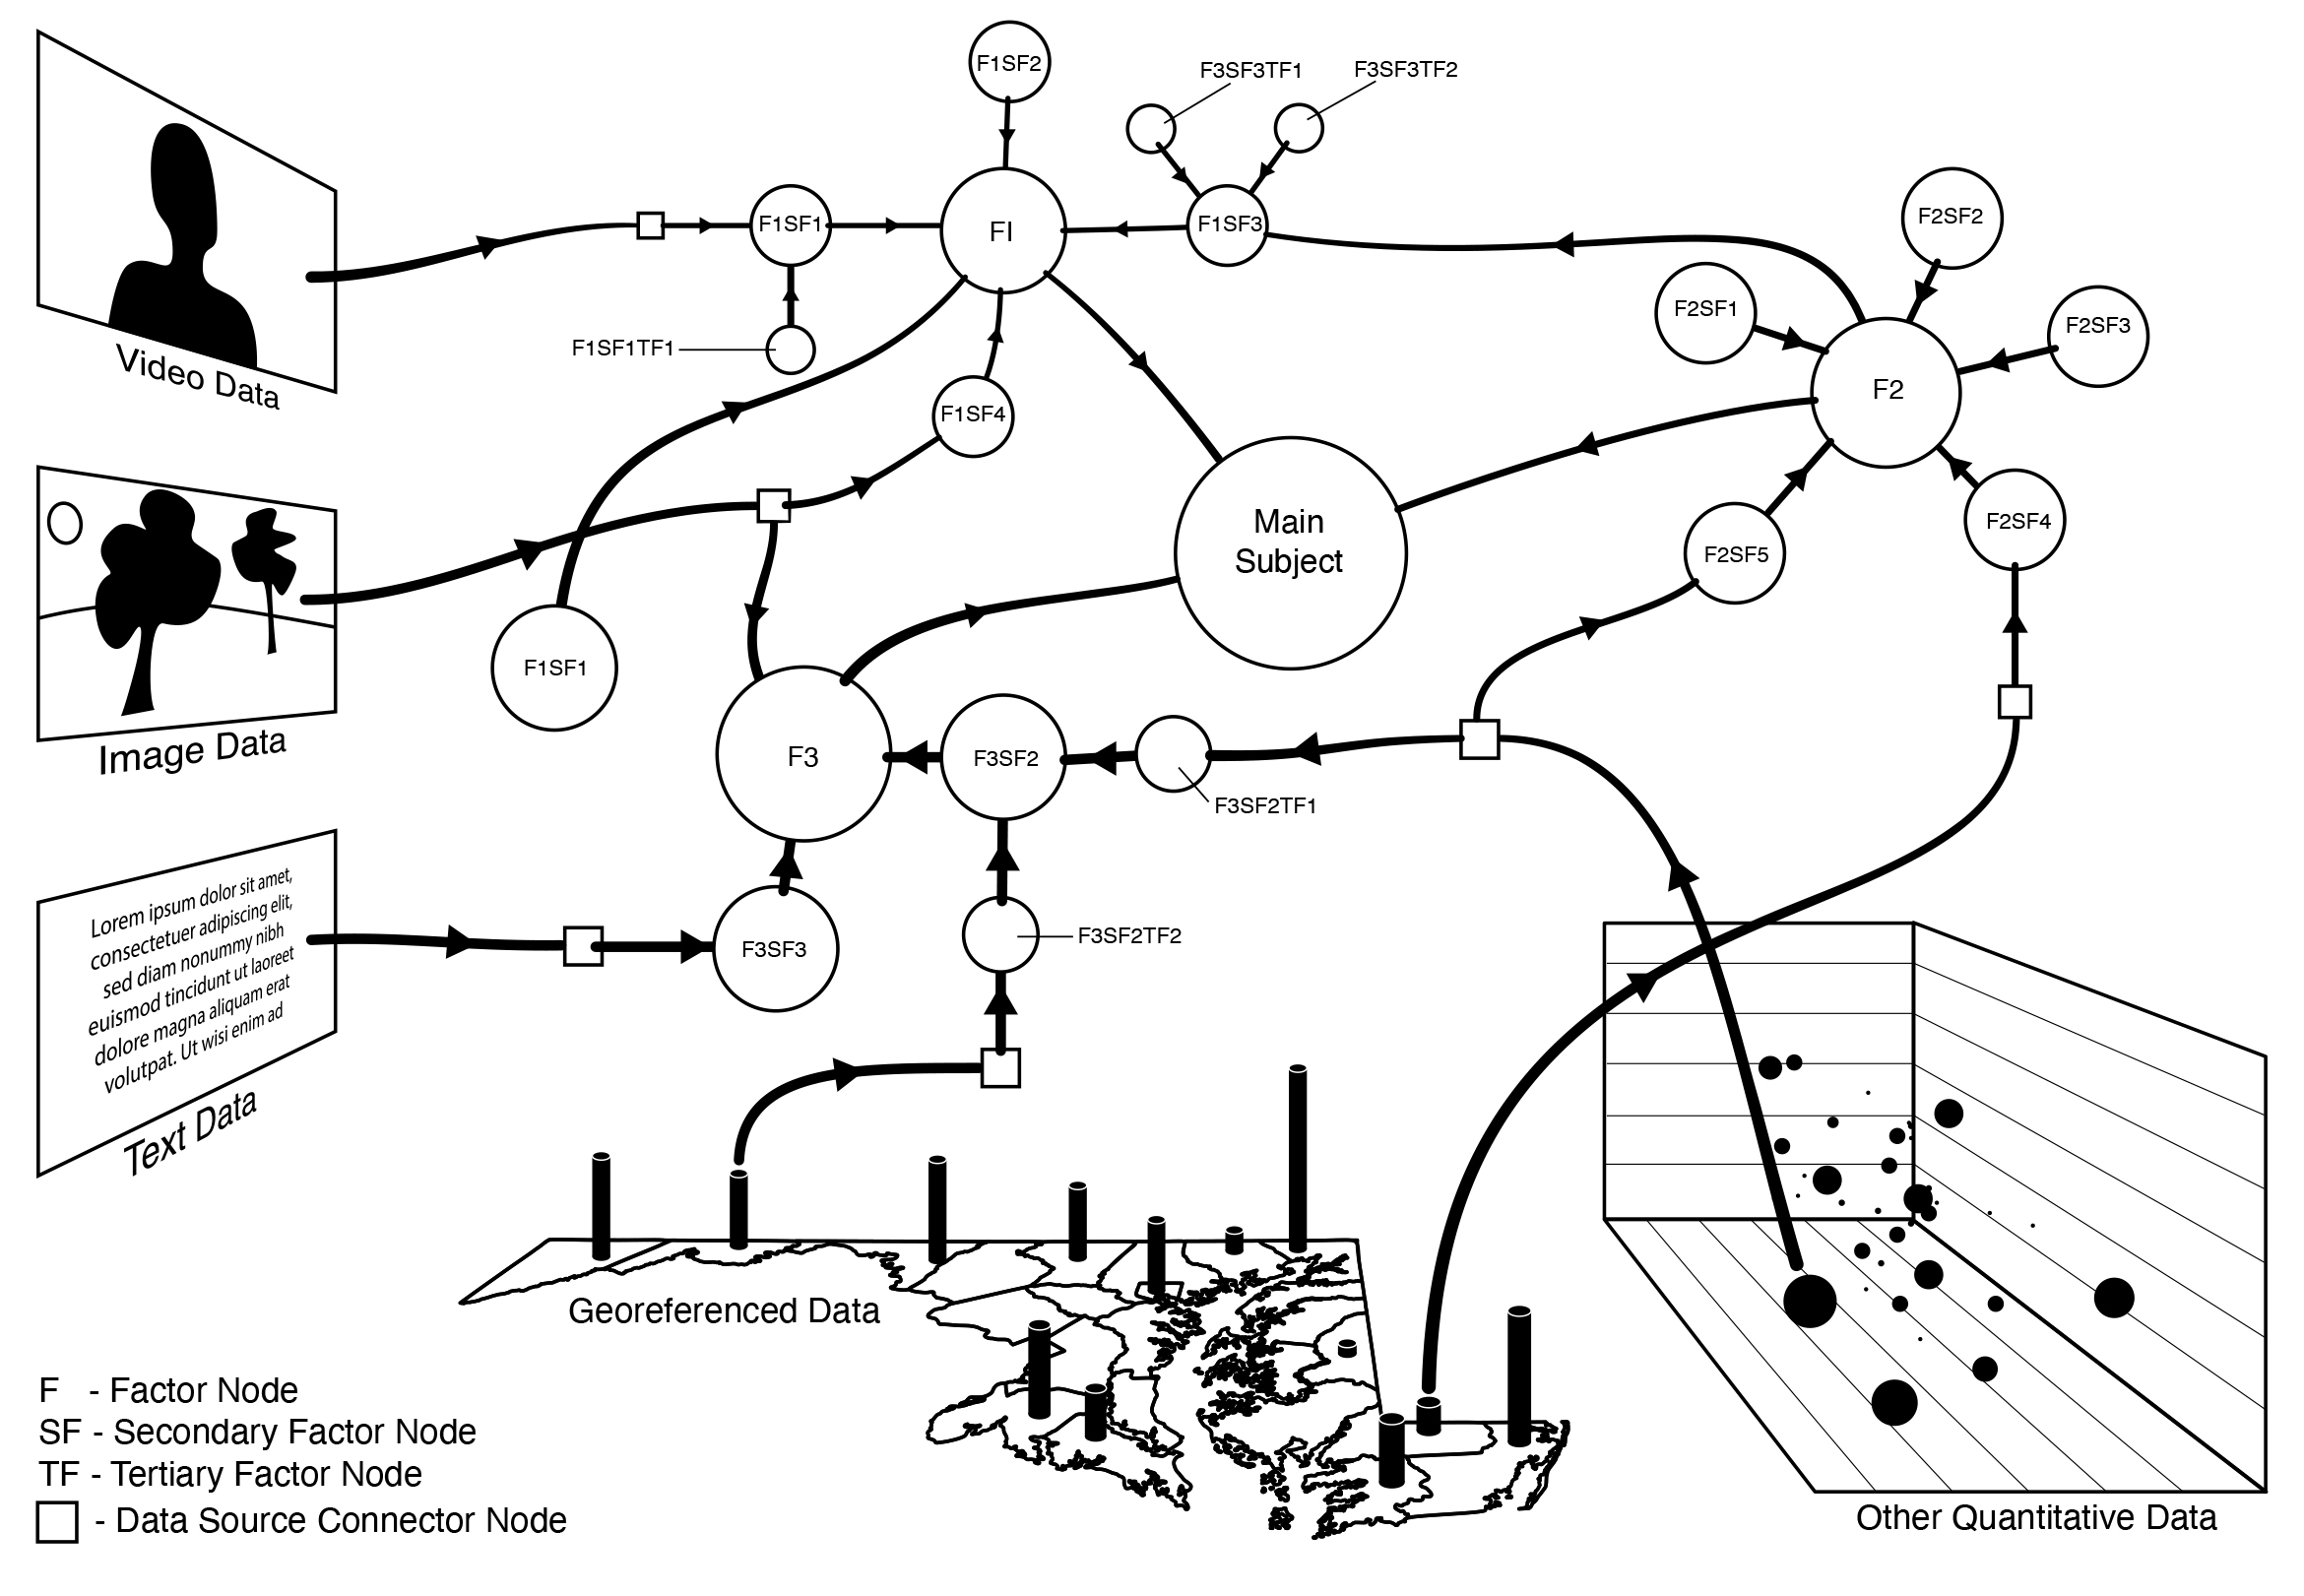
REVLR uses immersive VR and 3D visualization techniques to represent complex systems in a spatial, navigable environment. Users can integrate diverse forms of data—quantitative metrics, qualitative observations, and intuitive or emergent insights—into a single model. The platform allows these elements to coexist and interact, giving users a comprehensive view of the system they are studying.
By enabling full‑system modeling rather than fragmented analysis, REVLR supports deeper understanding of how a system behaves as a whole. This approach helps users identify hidden relationships, anticipate emerging trends, and incorporate cultural or contextual factors that traditional modeling tools cannot accommodate.
In short, REVLR is tool designed to help us meet complex systemic challenges by seeing them in space all at once, versus in pieces, over time. We hypothesize that preconceptions about data overload have less to do with how much data we see at once than how we approach analyzing it. After all, a walk in dense woods can be very relaxing.
Researchers and Creators
Investigators:
Concept, Project Direction: Lee Boot, Director of the Imaging Research Center
Evaluation: Anita Komlodi, Associate Director of the Imaging Research Center, Associate Professor of Human-Centered Computing
Lead Software Development: Tristan King, IRC Lead Software Developer;
Visual Asset Production: Ryan Zuber, IRC Technical Director, and Specialist in modeling and animation
Software Development: Kyle Davis, ’22, Computer Science and Electrical Engineering
Graduate and PhD Students
Evaluation: Priya Rajasagi, PhD Student of Human-Centered Computing
Software Development:June Young, Graduate Student, Department of Computer Science and Electrical Engineering
Undergraduate Students
Software Development:
Lilly Mills, Department of Computer Science and Electrical Engineering
Bradley Saunders, ’21, Computer Science and Electrical Engineering
Evan McRae, 25, Science and Electrical Engineering
Interface Design:
Bhargavi Sundar
Tawa Abiwa
Garvit Patwa
Funding
Gift, Robert W. Deutsch Foundation: $50,000
Epic Games: $150,000
UMBC TCF fund: $45,000
Publications, Papers, Presentations
Rajasagi, P., Yekini, M., Kunisetty, S., King, T., Zuber, R. J., Boot, L., … & Komlodi, A. (2023). Comparing and Evaluating Menu Placement for Immersive Virtual Reality. iConference 2023 Proceedings.
Rajasagi, D. P. (2023, March). Immersive Health Data Visualization in Virtual Reality. In 2023 IEEE Conference on Virtual Reality and 3D User Interfaces Abstracts and Workshops (VRW) (pp. 971-972). IEEE.
Included in the exhibit “Abstracts and Artifacts,” at The Peale. Boot, Lee (November 17, 2022 – February 12, 2023).