The first version of the Visualizing Early Baltimore effort, BEARINGS of Baltimore, Circa 1815, represented a huge accomplishment in terms of research, production, and satisfying short-term deadlines. Upon its completion, it was clear that the visualization could be used as a stage to tell important stories about Baltimore and early Federal cities for many years to come. However, what became clearer in the ensuing years was that it could also become a tool for scholars to conduct research. It could be a large, ever-growing geospatial database of any information relating to the city from 1810 to 1825. Thus, two new goals were set for further development of the project: 1) refining the visualization of the city to create a more accurate, detailed, and compelling stage to tell important stories, and 2) reworking the existing research into a standard geodatabase structure that other scholars could add to and use for their research.
Since 2017, Dan Bailey has been working to move all the original research data into ESRI’s ArcGIS software and database structure. This was a major effort, as the bulk of the original research was done on paper or using visualization software such as Photoshop and Maya. Neither of these programs uses or creates databases. It was not possible to search or footnote any information nor to track its sources. Everything had to be moved by hand into ArcGIS. As tedious as this was, it did allow for verifying existing data and incorporating newly found data. The result is a robust spatial database that is compatible with other web and visualization programs. Contemporary or historical GIS data from any source can now be brought in and overlaid.
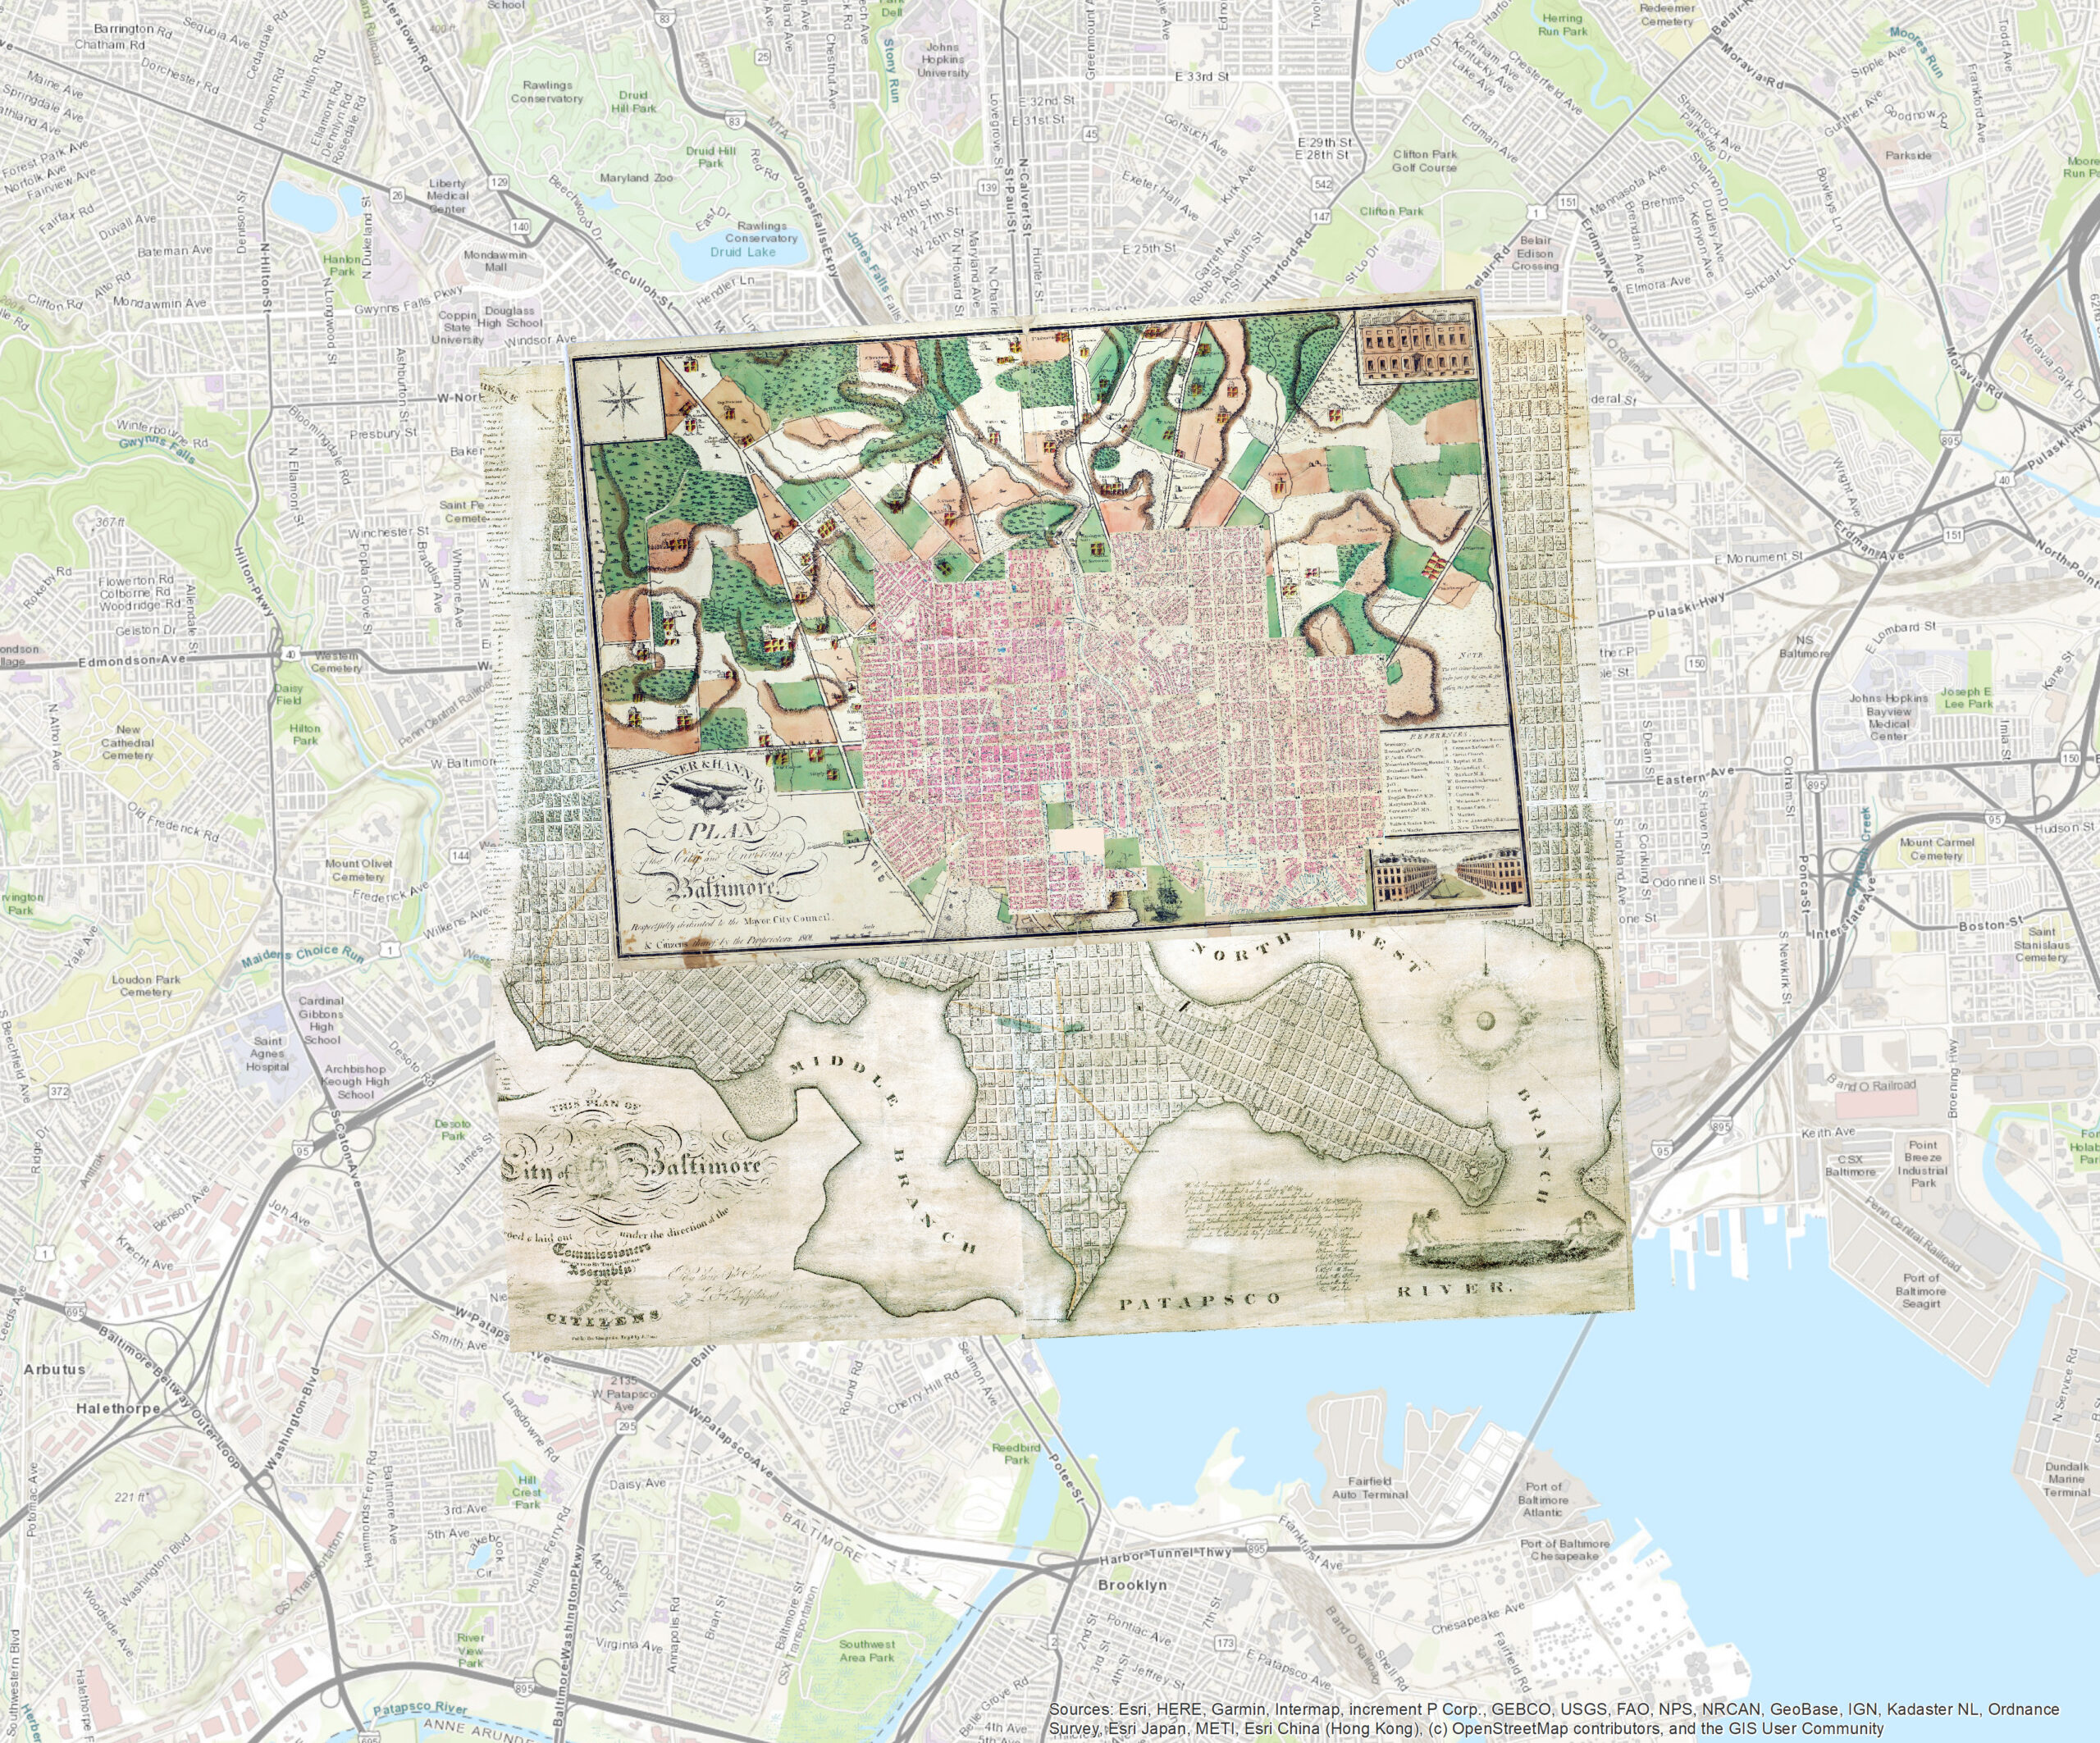
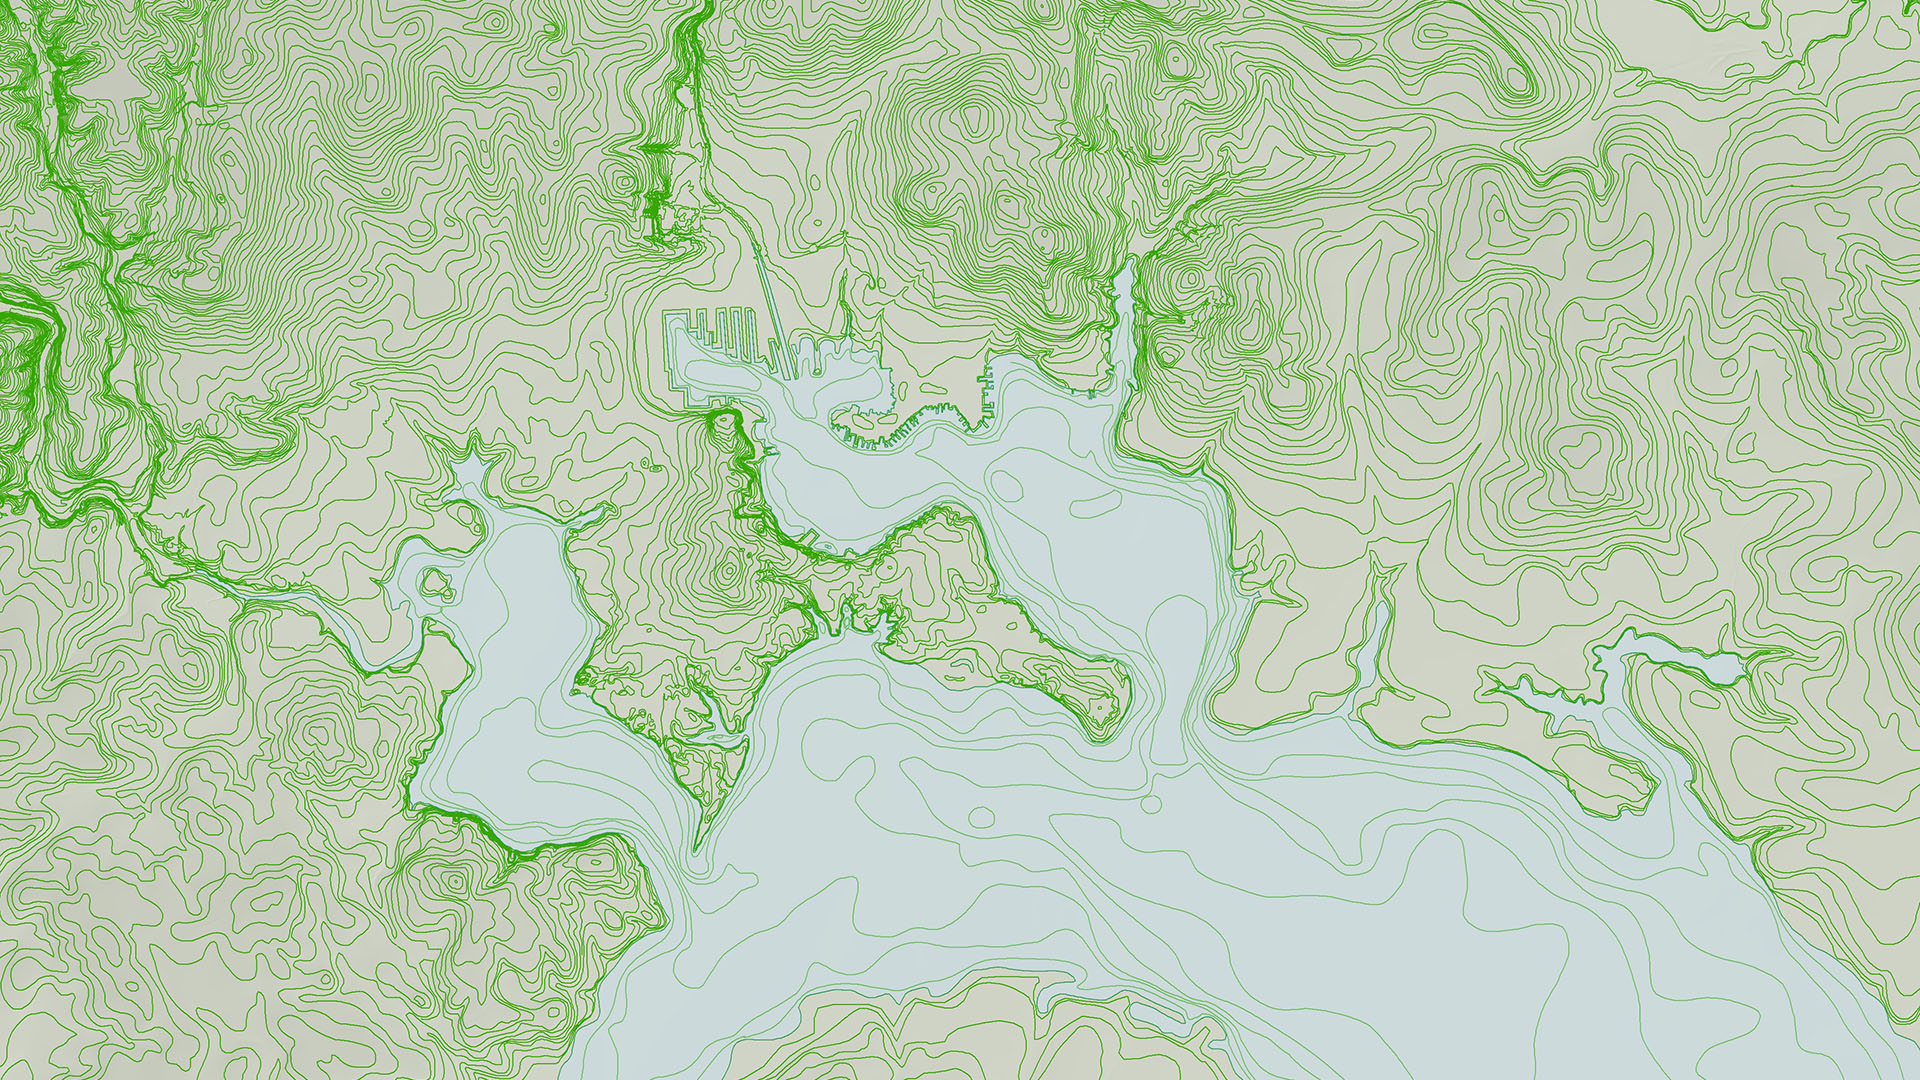
More than 100 historical maps have been geo-referenced to current map projections that are standard for mobile devices. Contour lines from early topographical maps were drawn by hand and covered the entire northern region of Maryland and the Chesapeake Bay. Additionally, bathymetric data for Baltimore Harbor and the Chesapeake Bay from the 1840s was added. The actual topographical area of the city was further refined by numerous other maps, paintings from the time period, and text. This has allowed us to create an accurate elevation map.
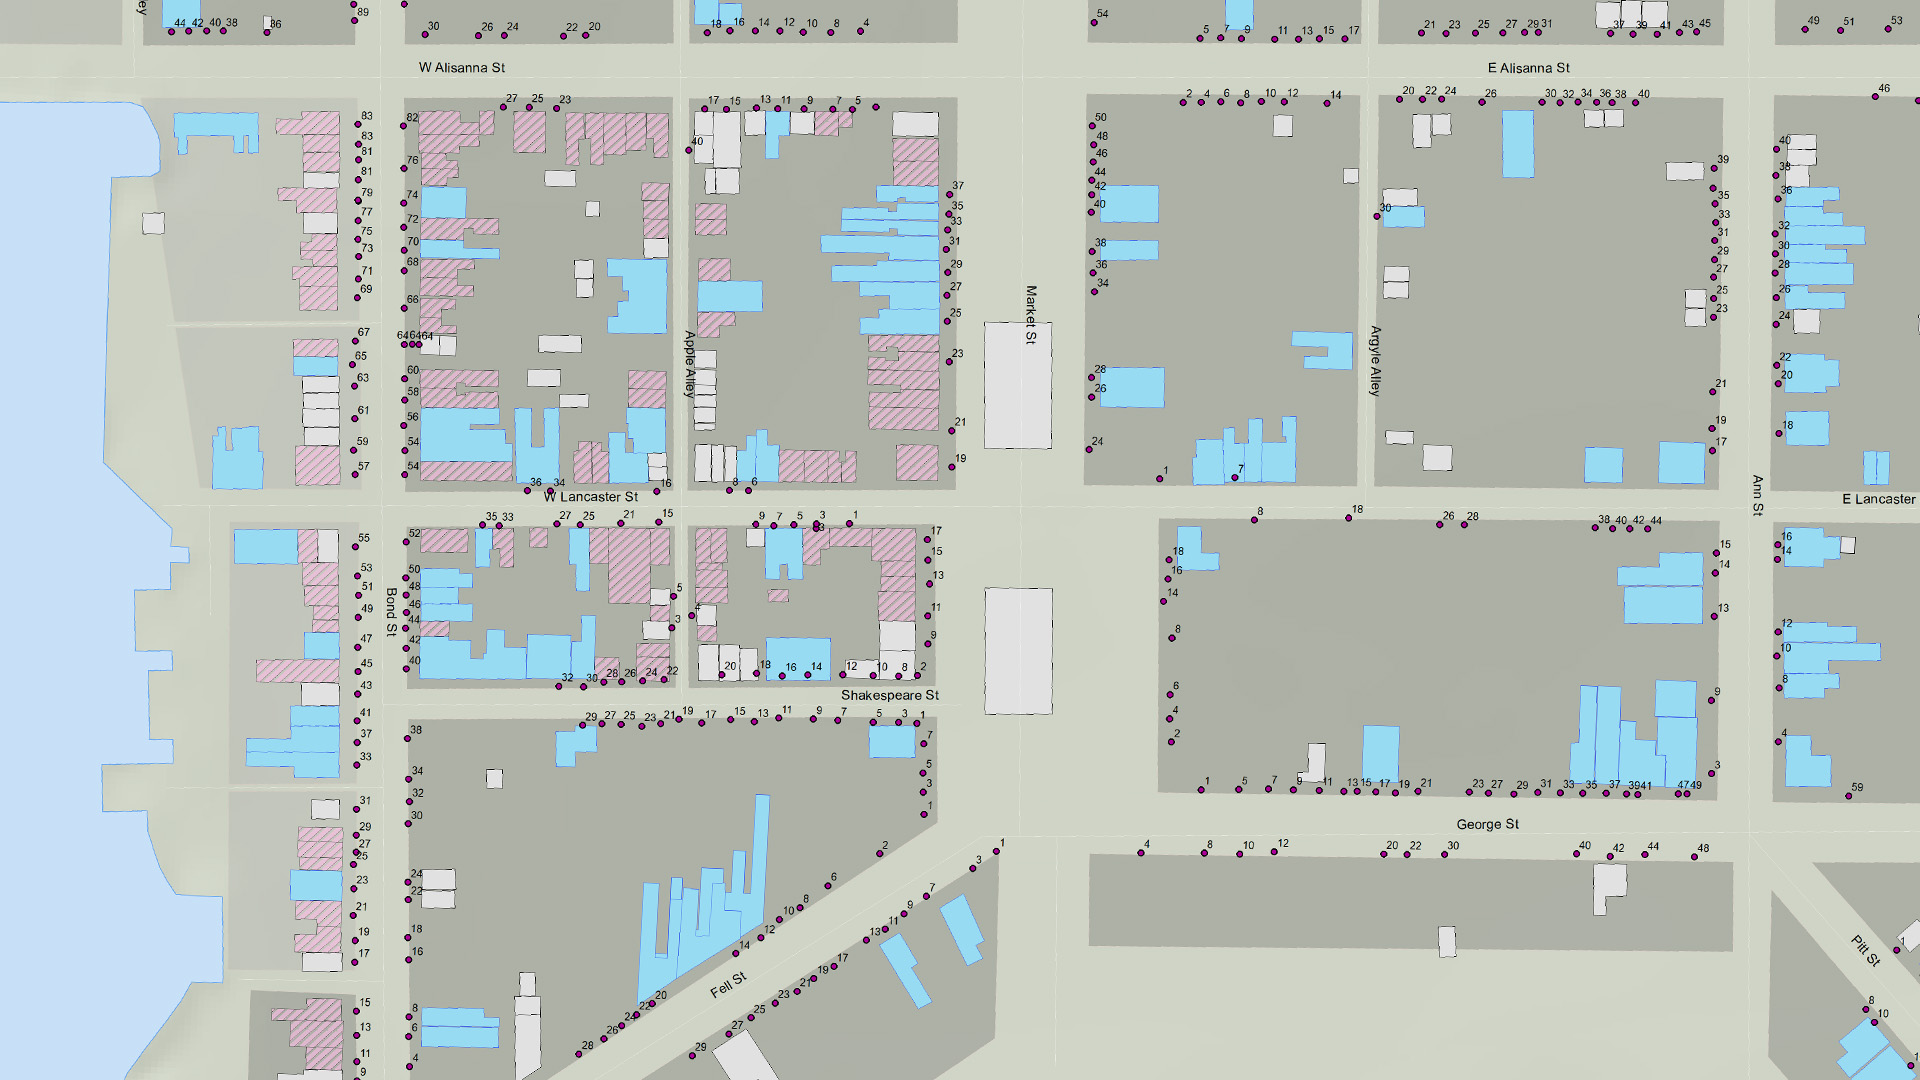
Currently, buildings are being added to the database. These are broken into 3 categories: extant, known, and assumed. Each entry includes its contemporary address, the date it was constructed, and notes. When complete, this will allow the IRC to create a very accurate depiction of how the city looked.
Imaging Research Center, UMBC © 2024